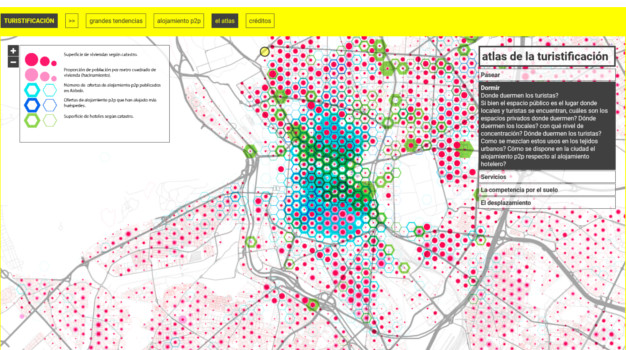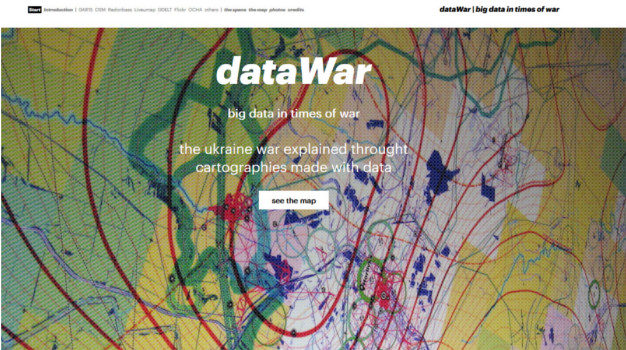
dataWAR | big data in times of war
The ukraine war explained throught cartographies made with data.
The overall number of documented casualties in the Donbass conflict, which started in mid-April 2014, now stands at 30,729, including 9,333 killed and 21,396 injured (UN Security Council meeting, 28th April 2016). Numbers vary widely depending on the source: 2,568 civilians were killed from 6 April 2014 to 15 February 2016 according to UN body OCHA while Donetsk People’s Republic reports 3,938 civilian deaths in roughly the same period. The opposing sides interpret information depending on their interests. In addition, data generation is a very slow process that could continue well beyond the conflict itself.
Traditional statistics, giving information on general indicators at a country level, become unable to describe a crisis situation like the ongoing war in the Donbass Region. On the other hand, media around the world act a barometer for the situation. Co-operation and human rights associations also report on the evolution of the conflict, and the Internet community, via social networks or collaborative cartography, can describe the problem at smaller scale. These other data sources, that are normally used to describe phenomena at an urban scale, become essential for accurately illustrating a territory under pressure.
For more information: architectureukraine.org/datawar
Credit: Data and design by 300.000 Km/s, powered by Izolyatsia, presented at La Biennale di Venezia.