SYLLABUS & FACULTY
PUBLIC SPACE DATA VISUALISATION WORKSHOP
This workshop was part of the Knowledge Alliance for Advanced Urbanism Project, co-funded by the Erasmus+ Programme of the European Union.

TUTORS: Aldo Sollazzo, Chiara Farinea with Mathilde Marengo, Daniele Ingrassia and Starsky Lara KA-AU PARTNER INTERVENTIONS: Luis Falcón (InAtlas), Andreu Ulied & Marite Guevara (MCRIT), Manuel Gausa (UniGe), Andrea Caridi (DARTS), Oliver Broadbent (USP)
The Workshop focused on using sensors and/or drones to capture data from public space, process the data and create dynamic alternative cartographies of the public space (based on data such as environmental data and flow patterns).
Output:
During this KA-AU workshop in Public Space Data Visualisation, we explored different tools that allowed us to shape the invisible layers of urban space. Our target space was the already implemented Superblock project in Barcelona, which involved the isolation of 9 residential blocks from cars, motorcycles and buses, in order to severely limit vehicles as a way to reduce traffic and air pollution, use public space more efficiently and essentially make neighbourhoods more pleasant.
Developping Data Acquisition Tools and Strategies
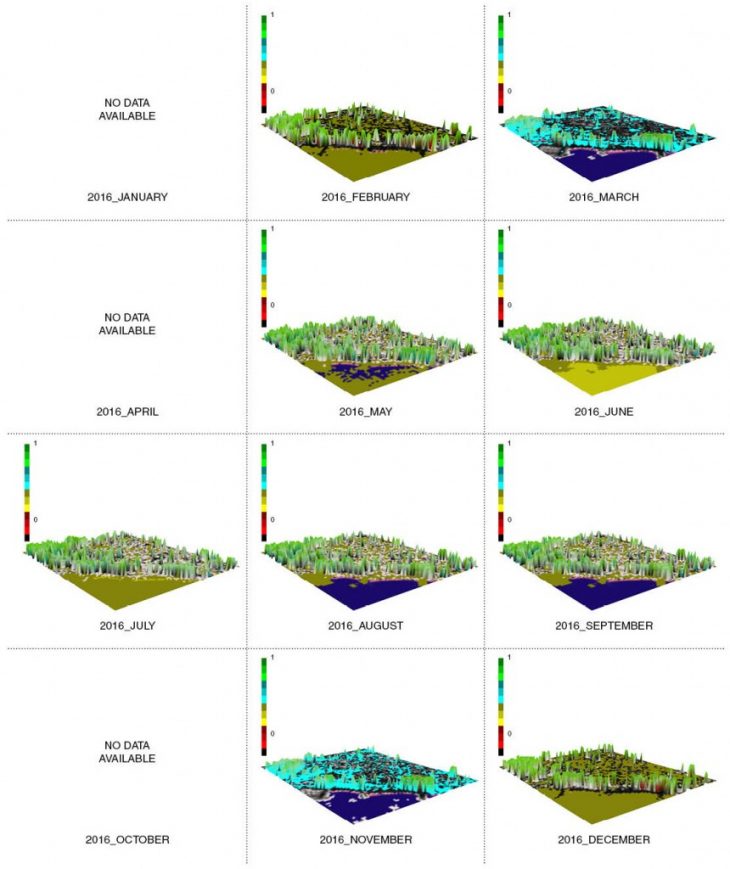
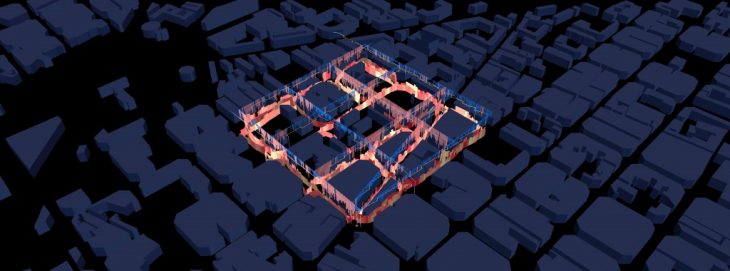
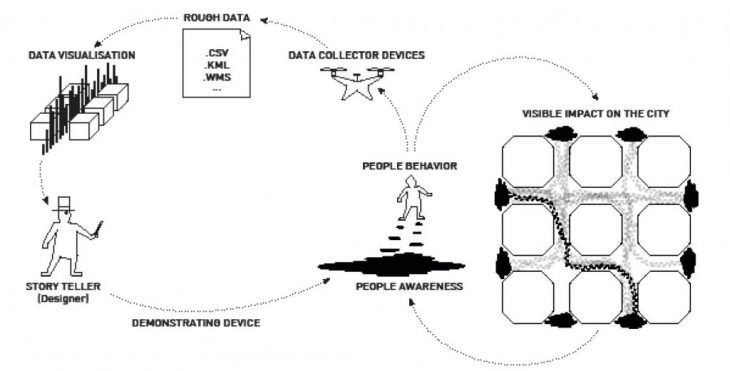
By creating a series of data capturing strategies and data visualisation tools we were able to look deeper into the amount of chlorophyll produced by the green areas of the Superblock, the levels of noise pollution, as well as the speed of mobility inside and outside of the Superblock. Moreover, by flying camera-equipped drones in the Superblock, we managed to explore a machine-learning software which we created in order to track and catalogue the mobility of pedestrians. One of the first layers that we explored was the chlorophyll content of the vegetation in the Superblock (and parts of the surrounding area), which we did by capturing data from the NASA Landsat satellite. This involved creating the NDVI (Normalised Difference Vegetation Index) maps for each month of the year 2016 for which the data was available. After using QGIS to reconstruct the data into maps, we visualised them using the Grasshopper plugin NERO.
Concomitantly, we wanted to create a virtual environment in which we would visualise different layers of the city. The chosen layers were connected to the noise pollution and the speed of mobility inside the Superblock. By using a sound recording app, we monitored the sounds of the neighbourhood during specific parts of the day and visualised them through Grasshopper. Additionally, by using a running app, we were able to collect data about the speed of mobility inside and outside of the neighbourhood.
 Visualising the sounds of the Superblock.
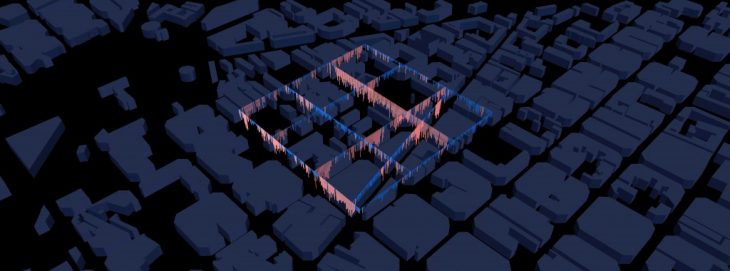
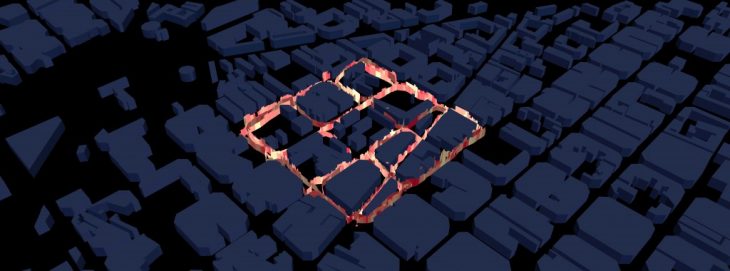 Visualising the speed of mobility inside and outside of the Superblock.
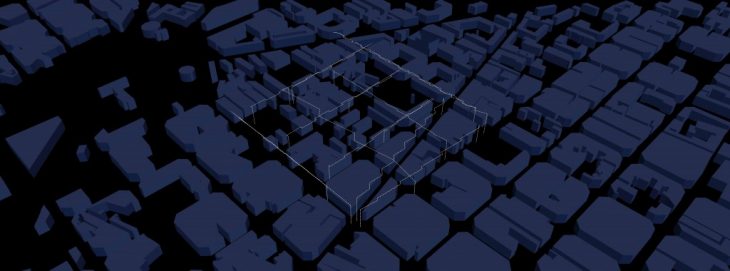 Visualising drone missions for data capturing inside the Superblock.
The idea was to visualise all this data in one common virtual environment in which through the use of Virtual Reality equipment and Grasshopper plugins anyone would be able to enter and experience the visualisation in a more immersive manner.
 One immersive VR environment with all the visualisations together.
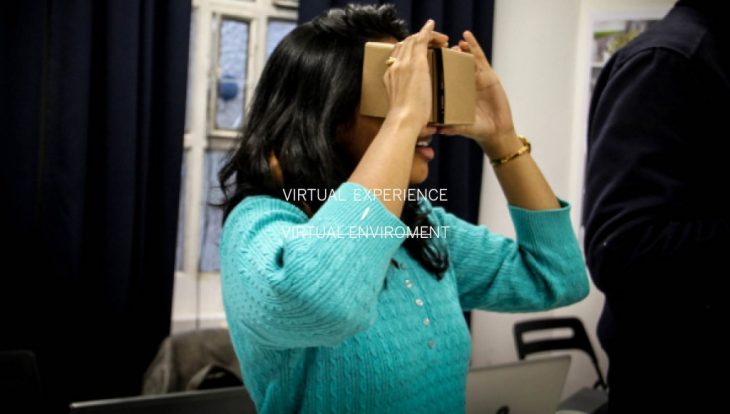 One immersive VR environment with all the visualisations together.
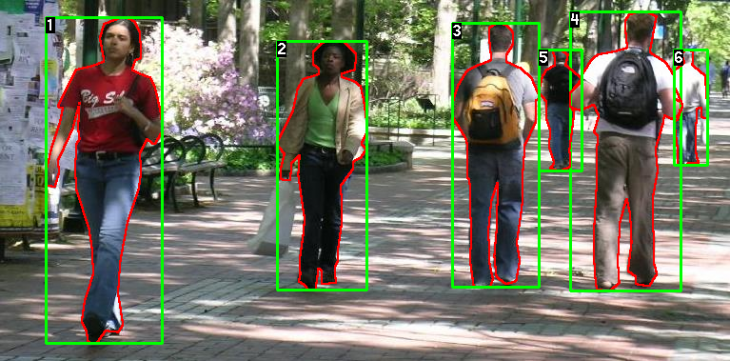
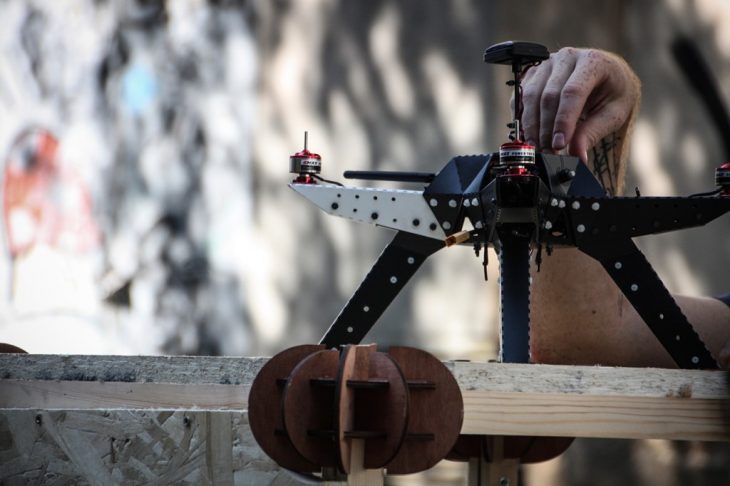
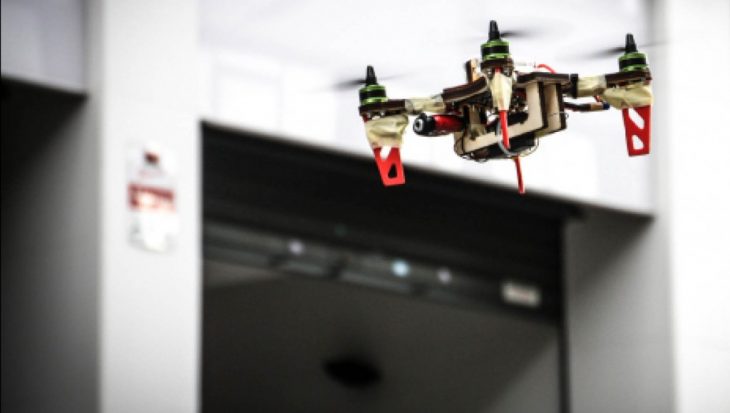
Finally, we planned and visualised drone missions that focused on the capturing and tracking of all mobility in the Superblock. To achieve that, we deployed camera-equipped drones inside the neighbourhood that took pictures of the area. Next, we combined the captured photos with a machine learning software (created with Python) which focused on identifying and counting the people found in the pictures. The goal was to see how we can use the combination of machine learning software and drones, in order to collect and analyse big data.
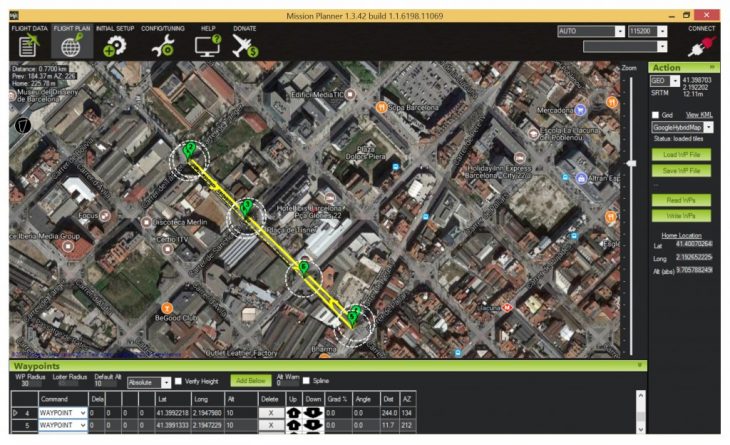 We defined the path needed in a specific zone with a software called Mission Planner.
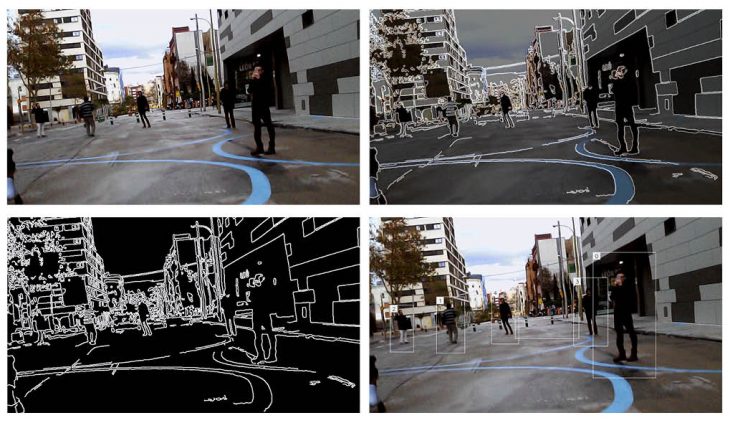
By developing all these various tools in order to uncover the hidden layers of an urban space which is currently under development, it was only natural that in the process we got to learn things about the Superblock that we didn’t know. This increased understanding of the area led to the production of a series of ideas which admittedly were dispersed and vague. Therefore, in addition to the tool development part of the workshop, we also focused on techniques that not only generate new ideas but also focused the ones we had already developed. This part of the workshop was not focused on generating solutions for the Superblock, but instead on the ways, one can learn how to exit the inevitable tunnel vision that is brought by extreme exposure to a specific multi-layered problem.
Idea Generation Techniques
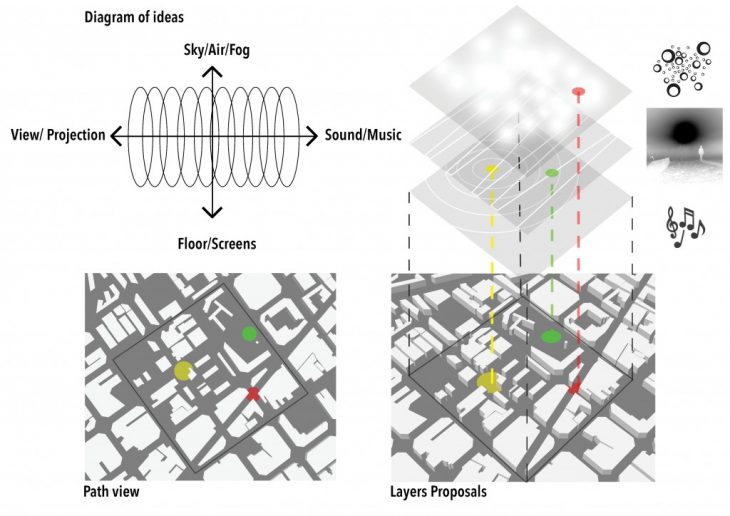
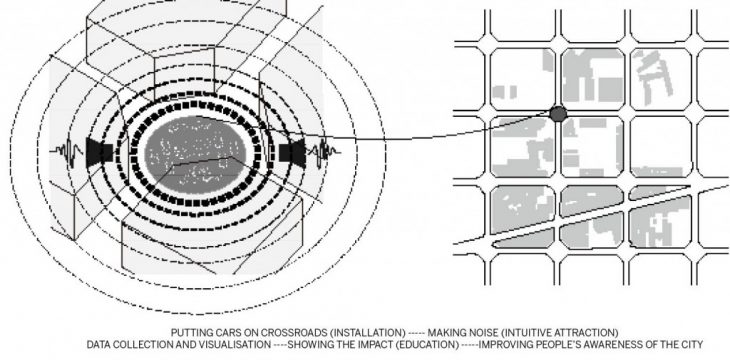
During this workshop, we learned how by Inverting an issue, Acting out an issue, Reframing an issue, Drawing an issue, Turning an issue into humour and Looking at an issue from 90 degrees, we are enabled to reconstruct our point of view and reframe it. The results of the application of these idea generation techniques brought some interesting results. The first idea was to make Poblenou citizens aware of the invisible data. We were thinking of using a bubble machine to show the density of smell or projecting light on smog to express the high quantity of CO2 or even playing music to show the high level of noise in the neighbourhood. The goal was to express virtual data lightly.
An idea that started from a humorous approach to the mobility layer of the Superblock was one that focused on tracking the mobility of people by painting the soles of their shoes. However, not wanting to irritate the pedestrians the idea evolved into an idea that focused on using chalk mats, GPS or even LPS trackers in order to track the most commonly used roads in the Superblock. In that way it would be possible to recognise which building are mostly used, which roads are mostly taken and create a guide for any future design intentions.
Data does not only have to be in weird numbers and alienating figures, but it can also be something more relatable to both citizens and scientists: painted footsteps on the street.
Finally, this workshop was a great introduction to the deeper layers of a city and any urban space and in the importance that lies in the efforts to bring them to surface. By uncovering them, it is possible for the residents to connect with their neighbourhood on a much deeper level, thus increasing their respect for the urban environment. Admittedly if these data acquisition tools and strategies were combined with a concrete purpose and a solid theory to guide them, they could easily lead to the proposal of effective solutions for urban spaces such as the Superblock.
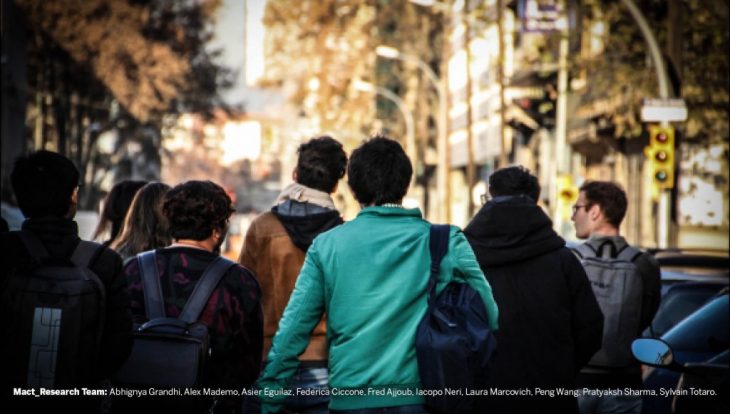

Shaping the Invisible is a project of IaaC, Institute for Advanced Architecture of Catalonia at Master in City and Technology in 2016/2017 by: Students: Abhignya Grandhi, Alex Mademo, Asier Eguilaz, Federica Ciccone, Frederick Ajjoub, Iacopo Neri, Laura Marcovich, Peng Wang, Pratyaksh Sharma, Sylvain Totaro Faculty: Aldo Sollazzo, Starsky Lara