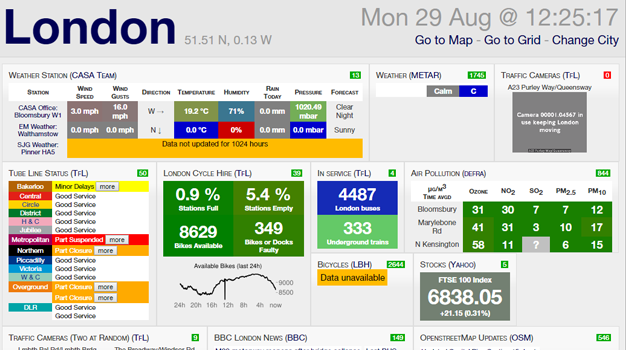
Mapping (real time)
An example of mapping (real time) is the London City Dashboard on microclimate – air quality, temperature
http://citydashboard.org/london/
Information provided by Judith Sykes at the 8th Symposium Métropoles du Sud – ENSAM (January 2016)